Software we wrote for our own laboratory.
Every extraction we optimize and every chromatogram we report passes through tools we developed ourselves. Two of them are free and open source. Scientific and process software has been developed for laboratories, producers and R&D groups.
01. Our own software
AltraFlora both manufactures plant extracts and designs the processes behind them, and tests every result in its own laboratory. From raw material through process design and production to the analytical report, few companies cover the whole chain the way we do.
Running that many different processes well is only possible with quantitative modelling that takes every step into account. And because we look at the same batch from the plant, the laboratory and the cost side, the established calculations and the software that ships with the instruments often fall short. So, when needed, we write our own tools.
02. SupeRcrit — extraction process development
SupeRcrit takes an extraction from the first lab question to the cost per kilogram and the profit it earns. It is written for process engineers, R&D chemists and anyone deciding how profitable a supercritical extraction line will be.
- Kinetic modelling. Fits measured extraction curves with Sovová's broken-and-intact-cells model and the two-site desorption model, with built-in CO₂, ethanol and water density calculations. (In active development.)
- Co-solvent selection. Starts from a compound name, CAS number or SMILES, estimates its Hansen solubility parameters and critical properties from structure, and maps which co-solvent improves solubility most between 75 and 1000 bar and 31 and 200 °C.
- Design of experiments. Full and fractional factorial, central composite, Box-Behnken and Taguchi designs for two to five factors.
- Response surface optimization. Builds and trims the model with lack-of-fit testing, ANOVA and stepwise regression, then finds the optimum for one response or balances several at once.
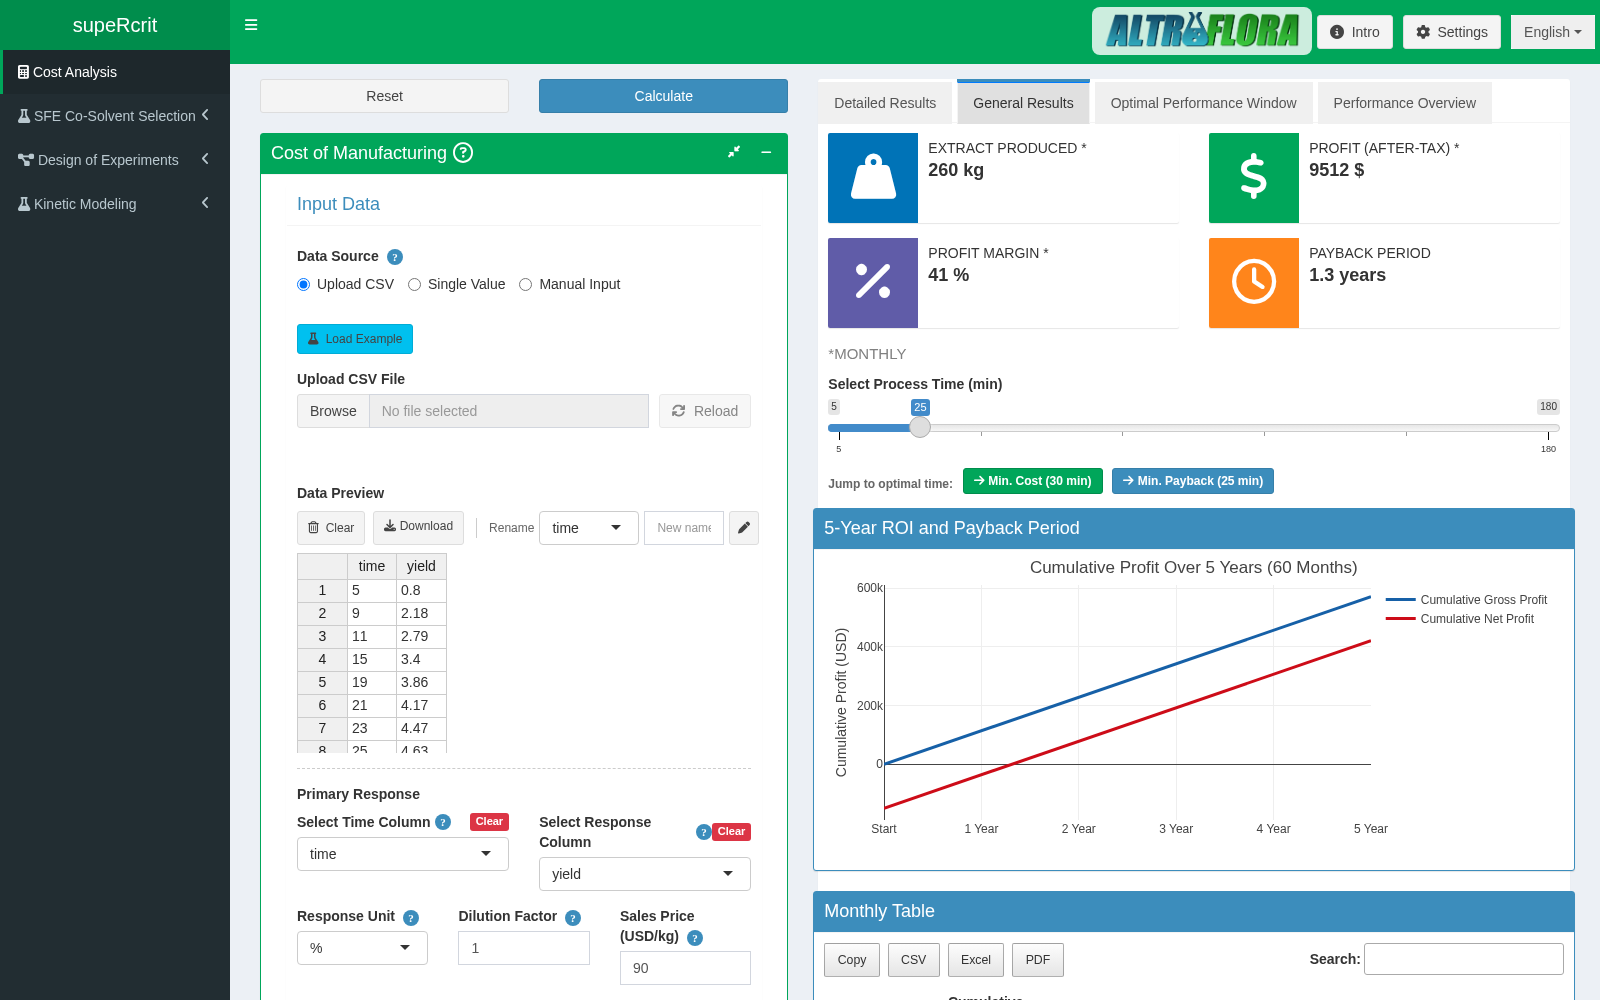
- Cost of manufacturing. Adds up raw material, labour, utilities, waste and fixed costs including depreciation, and calculates monthly profit before and after tax, profit margin and payback period at every point of the extraction, so you can pick the most profitable run time. The interface then projects cumulative gross and net profit month by month over five years, starting from the investment.


03. LCQC — chromatography quality control
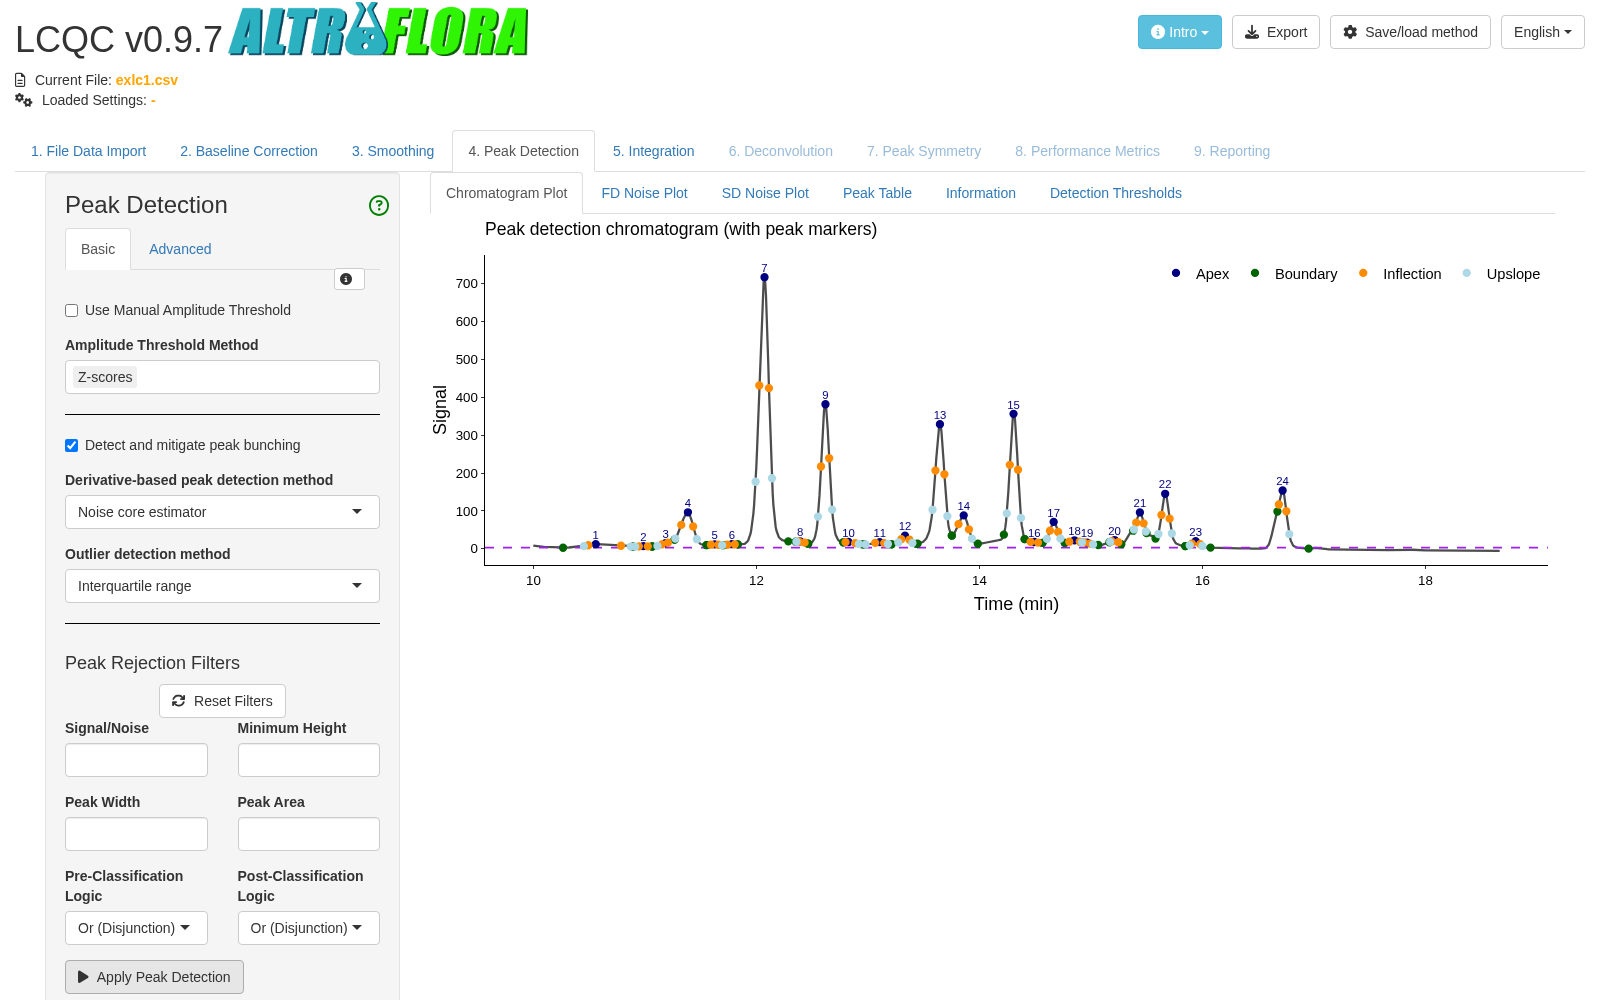
LCQC turns a raw chromatogram into a column performance report. It is written for QC and analytical laboratories that need to know, run after run, whether a column and a method still perform.
The interface walks the analyst step by step from file to report:
- Import a CSV file or a Shimadzu LabSolutions export (HPLC, GC-FID, GC-MS).
- Correct the baseline and smooth the signal.
- Detect peaks automatically, filtered by signal-to-noise ratio.
- Integrate peaks, and separate overlapping peaks by iterative curve fitting.
- Calculate column metrics: plate number, reduced plate height, tailing and asymmetry factors, retention factor, selectivity and resolution.
- Export a PDF report in English, Turkish or Russian, plus the data as CSV.
Peak detection and integration follow the published rules of the major commercial chromatography data systems, so results can be checked against the software your laboratory already uses.


04. Software for you
The problems we solved in SupeRcrit and LCQC (processing instrument data, modelling the process, planning experiments, calculating cost) are everyday problems for many laboratories and plants too. If you have a similar need, we can develop a tool that fits your data and your workflow. The areas we work in:
Instrument data processing
Reads your instruments' export files, finds and integrates peaks in batches and builds the tables, with no copying by hand.
QC checks & automated reports
Compares results with specifications and system-suitability limits, then writes the report or certificate in the language your customer reads.
Process models & calculators
Kinetic models, fluid property and mass balance calculations, and scale-up tools fitted to your own process data.
Experiment design & optimization
Experimental plans and response surface analysis for extraction, formulation or synthesis, with several goals weighed together.
Cost & feasibility tools
Cost of manufacturing, payback and scenario comparison for investment and pricing decisions.
Chemistry data tools
Fetching compound data from public databases, estimating properties from structure, and choosing solvents.
Interfaces anyone can use
Browser applications in your languages, with guided tours and your company's logo, running on your computer or your server.
05. How a project runs
- A short call and a sample of your data. Real files tell us more than a long specification.
- A written scope and quote. What the software will do, what it will not do, and what you will receive.
- An early working version on your own data. You see results before the details are polished.
- Delivery and training. An installed tool, documentation, and a session with the people who will use it.
06. Open source & citation
SupeRcrit and LCQC are free to use under the MIT licence. The source code, installation instructions and documentation are on GitHub, and each package includes a citation entry for academic work.